
EUROPEAN DEMOGRAPHIC DATA SHEET 2018
Explore, visualize and compare population indicators for 45 European countries.
Explore, visualize and compare population indicators for 45 European countries.
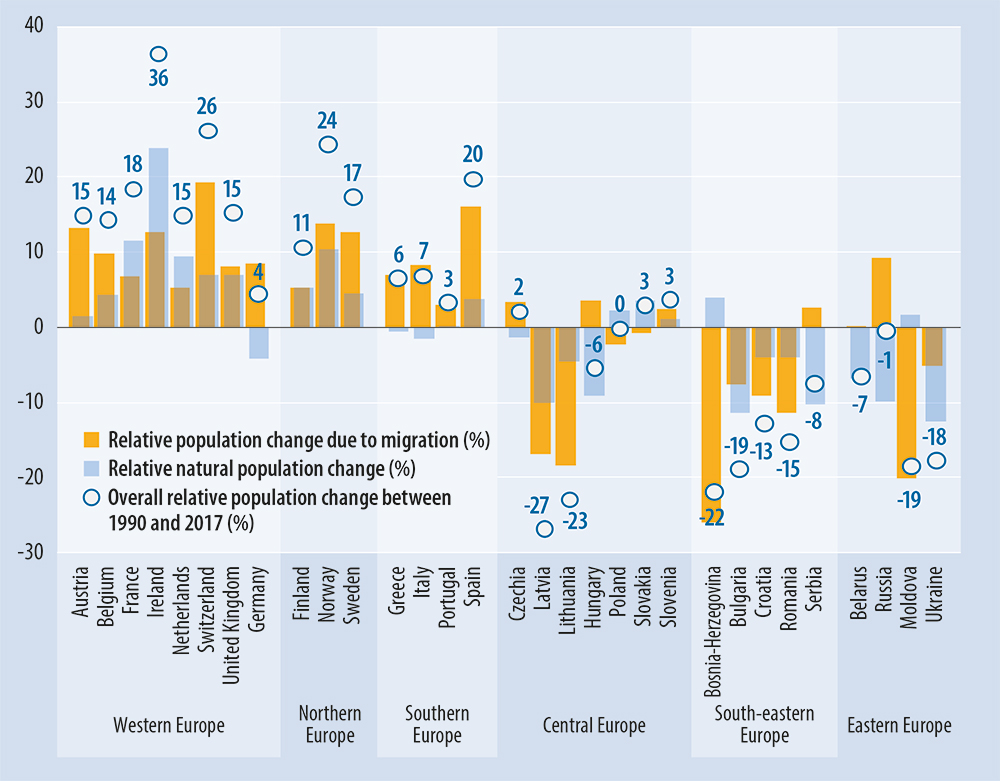
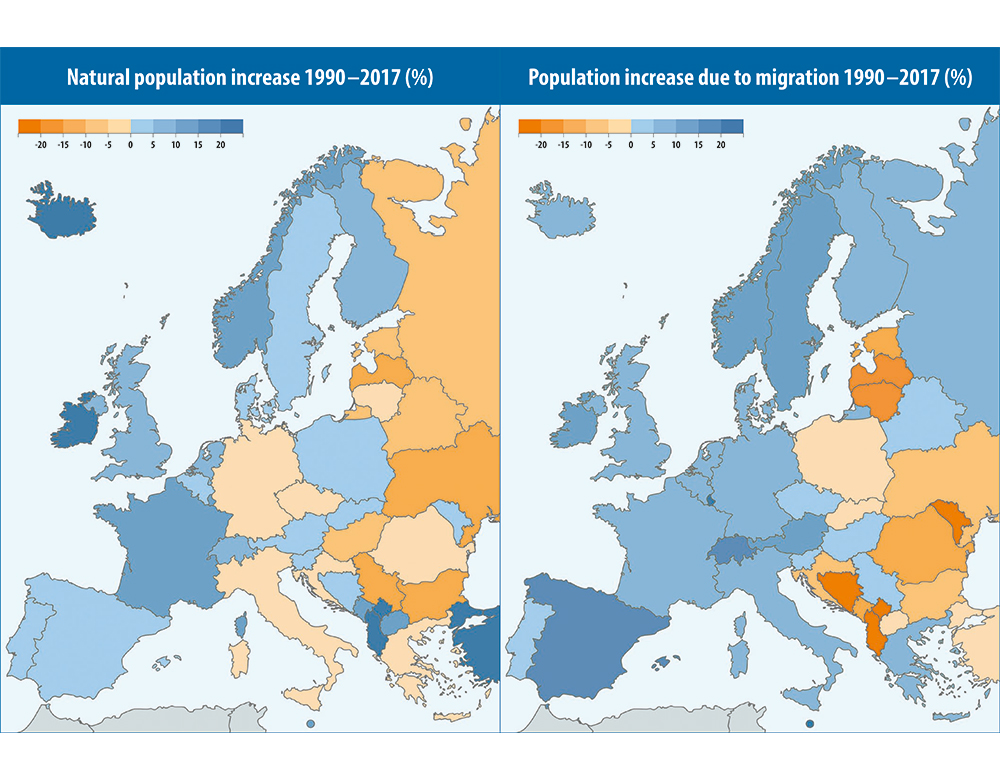
Europe today remains divided by long-term population trends. This division mostly follows the past geopolitical cleavage between Europe’s East and West.
Countries in the comparatively rich regions – the West, South, and North – continue to experience rising population sizes, due to a combination of minor natural population increases and higher levels of immigration than emigration. Only a few countries, including Germany and Italy, saw a slight natural decrease in their populations between 1990 and 2017, due to deaths outnumbering births. Natural changes in population size have been overtaken by trends in migration, pushing change in the opposite direction. Ireland, Norway, Spain and Switzerland as well as several other smaller countries have seen their populations expand by more than 20 % since 1990. Except in Ireland, migration has driven most of the recent population expansion.
In contrast, almost all countries in Central, South-Eastern, and Eastern Europe saw substantial population declines, due to a combined effect of natural population decrease and emigration. Several countries, such as Bulgaria, Latvia, Lithuania, Moldova, Bosnia and Herzegovina and Kosovo (not shown) observed a shrinking of their populations by 19% or more, unprecedented in times of peace. Several richer countries of the region – Czechia, Slovenia, and Slovakia – have recorded slight population increases and in Russia a large surplus of deaths over births has been almost entirely offset by positive net migration from the countries of the former Soviet Union.
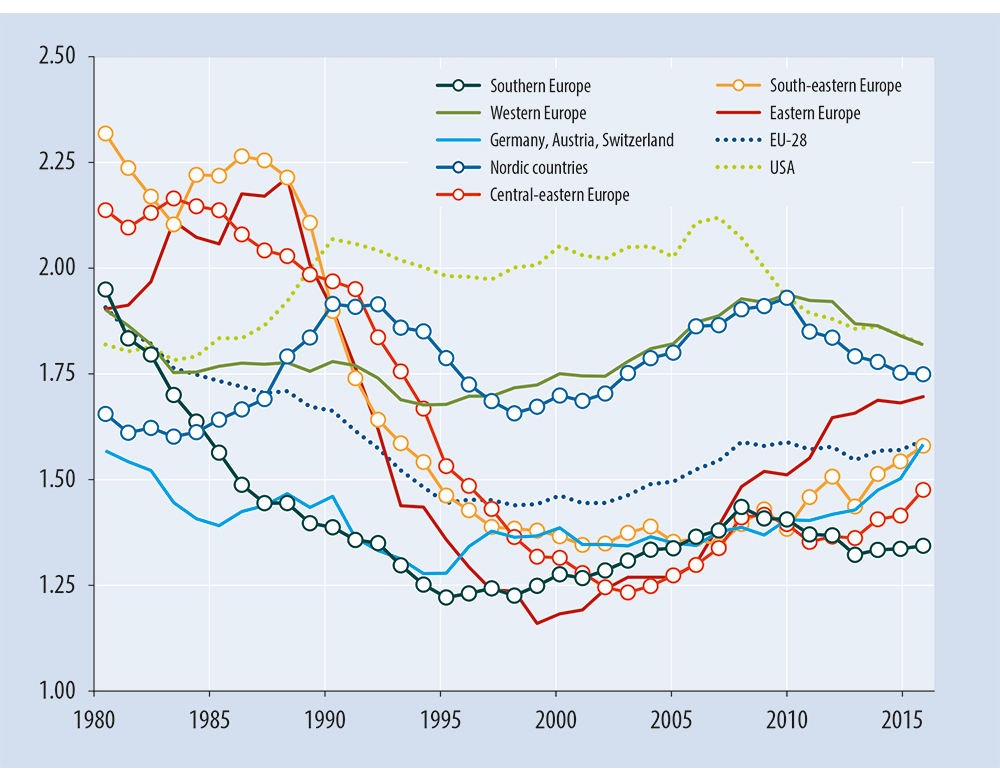
Following turbulent changes and declines in period fertility throughout the 1980s and 1990s, fertility in Europe appeared to split into a north-west vs. south-east divide. Northern and Western Europe (with the exception of Germany, Austria and Switzerland) reached moderately low fertility, with the period Total Fertility Rate (TFR) at 1.7–2.0. All other regions in Europe had either low or very low TFR, typically reaching between 1.2 and 1.4. This regional differentiation was firmly established by the late 1990s, and was retained during the period of gradual recovery in fertility during the 2000s.
However, the fertility divide began to narrow following the onset of the economic recession in Europe, often continuing on even after the recession ended. Period TFR has increased vigorously in Eastern Europe, in part supported by pronatalist policies in Russia, Belarus and Ukraine. Fertility also recovered in Central-Eastern Europe, South- Eastern Europe as well as in Austria, Switzerland and Germany, where it reached the highest level since the 1970s. The TFR of several regions – Eastern Europe, Central-Eastern Europe and Germany, Austria and Switzerland, now occupies a previously vacant ‘medium’ position, at around 1.5–1.7. In contrast, the TFR has declined over the last decade in Western Europe and the Nordic countries, bringing fertility below the peaks reached around 2008–2010. As a result, regional and cross-country fertility differences have reduced across Europe in the last decade. This surprising regional regrouping of period TFR in Europe has taken place at a time when TFR in the United States continued on a downward trajectory, reducing the fertility discrepancy between the United States and European Union.
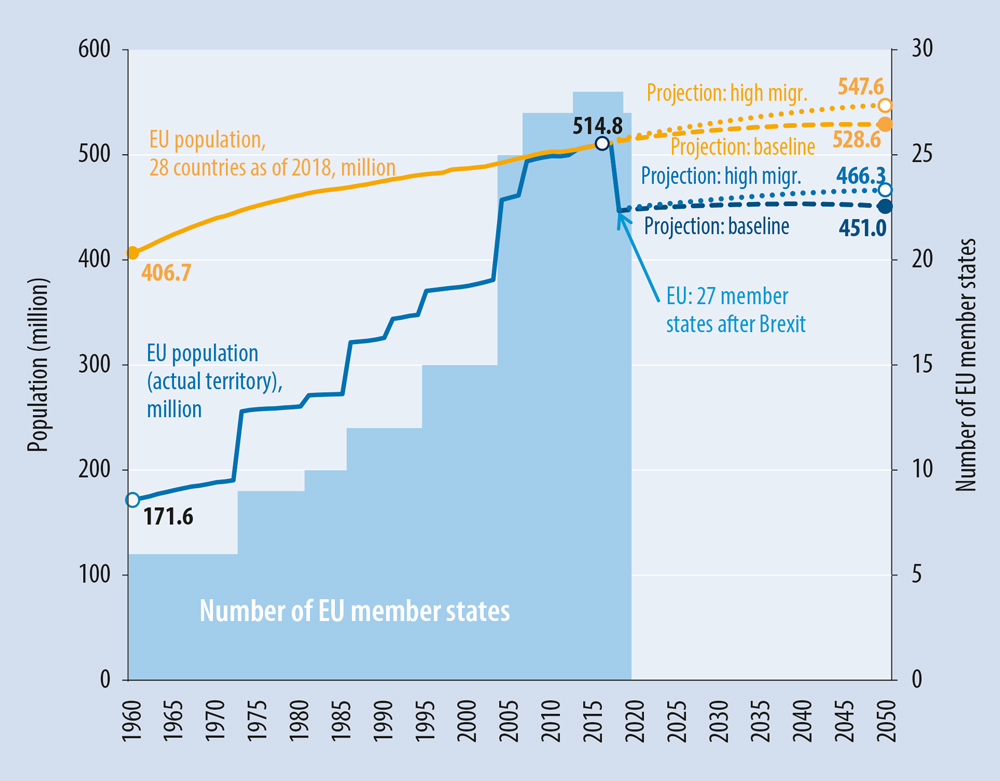
Despite recurring fears about an impending population implosion in Europe, the population is in fact growing. Countries currently comprising the European Union have collectively experienced sustained population growth ever since the European Economic Community was established in 1957. The territory of the current EU-28 member states saw population increase gradually through a combination of natural population growth and immigration. Between 1960 and 2016 the population grew by 100 million, reaching a 500 million milestone in 2008, and is expected to reach 513 million by 2018. Taking into account the rapid expansion in EU membership, the population of the European Union, as a political entity, has increased at a much faster rate from various waves of EU enlargement.
As the number of EU member countries grew from six before 1972 to 28 since 2013, the population living in EU territory has tripled since 1960, when it stood at 172 million. Although in 2015 the EU experienced natural population decline (i. e., an excess of deaths over births) for the first time in its history, continued migration is expected to fuel further population growth. According to the baseline projection scenario of Eurostat, the total population of EU-28 is expected to grow to 528 million by 2050, while the high migration scenario propels the EU-28 population even further to 547 million.
However, with the looming secession of the United Kingdom from the European Union, the EU’s earlier rapid population growth through territorial enlargement will reverse. If the United Kingdom leaves as scheduled in March 2019, the EU population is expected to contract by 13 percent, from 515 million to 448 million. Even the high migration scenario of Eurostat envisages an EU population that remains well below the 500 million mark by 2050.
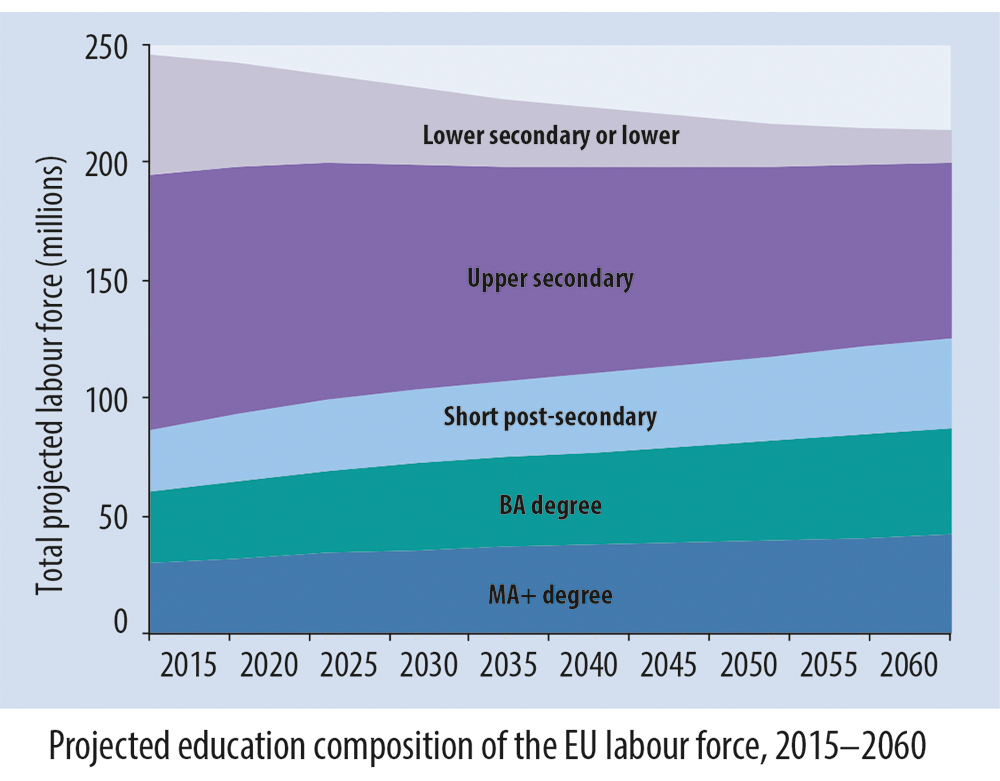
Changes in labour force size present one of the main challenges coming from population aging in the European Union. While labour supply (labour force size) does not develop independently of labour demand, trajectories of future labour supply can be estimated by combining various scenarios of labour force participation with population projections. Such projections are produced regularly by national institutions as well as international organizations. Here we go one step further, factoring in not only changing population structure by age and sex, but simultaneously considering changes in the highest level of educational attainment. This allows us to take into account that 1) labour force participation rates vary not only by age and between men and women, but also by education, and 2) populations are not only changing in their age structure, but also in their educational composition (see data on the front page of this datasheet).
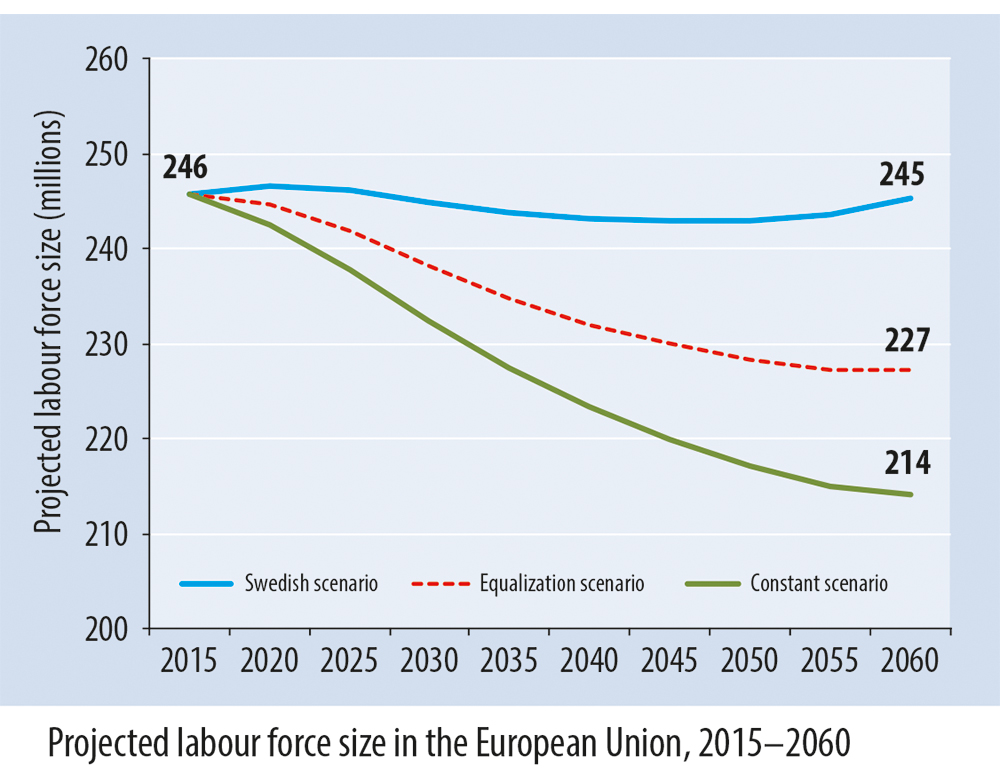
The current (2015) labour force in the European Union comprises of about 245 million workers. In order to estimate a range of future labour supply up to 2060, we defined three scenarios for labour force participation: 1) Constant scenario, where age-, sex- and education-specific labour force participation rates are held constant at the 2014–16 levels; 2) Equalization scenario, which takes into account the effect of strong increases in women’s participation in the labour market, and assumes that female participation rates by age and education reach current country-specific levels recorded for males; and, finally, 3) Swedish scenario, assuming that labour supply in each country would develop towards age-, sex- and education-specific participation rates currently observed in Sweden. This scenario draws from the vanguard position of Sweden, which serves as a model in terms of high levels of female labour force participation and participation above age 50.
The outcomes of these three scenarios are illustrated here for the EU-28 when applying country-specific assumptions. While constant participation rates would lead to a decrease in labour supply by 13 % by 2060, a continued strong increase in female labour market attachment would reduce this decrease to only about 8 %. At the same time, labour force size in the Swedish scenario would maintain near stability.
Our approach to calculating projections allows us to make statements about the future composition of labour supply by education. For example, under the constant participation scenario, the number of persons in the labour force with higher than secondary education is projected to expand by about 45 %. The expected reduction in labour force size would only come from the population with lower and upper secondary education. As a result, the composition of the labour force would change considerably. Further details and country-specific results can be found in the recently published report on Demographic and human capital scenarios for the 21st century (Lutz et al. 2018).
References:
Loichinger, E. and G. Marois. 2018. Chapter 4: Education-specific labour force projections for EU-28 countries. In: Lutz, W. et al. (2018), pp. 44–51 (see next reference).
Lutz W., A. Goujon, S. KC, M. Stonawski, and N. Stilianakis (Eds). 2018. Demographic and human capital scenarios for the 21st century. Luxembourg: Publications Office of the European Union [pure.iiasa.ac.at/id/eprint/15226/].
Europe today remains divided by long-term population trends. This division mostly follows the past geopolitical cleavage between Europe’s East and West.
Countries in the comparatively rich regions – the West, South, and North – continue to experience rising population sizes, due to a combination of minor natural population increases and higher levels of immigration than emigration. Only a few countries, including Germany and Italy, saw a slight natural decrease in their populations between 1990 and 2017, due to deaths outnumbering births. Natural changes in population size have been overtaken by trends in migration, pushing change in the opposite direction. Ireland, Norway, Spain and Switzerland as well as several other smaller countries have seen their populations expand by more than 20 % since 1990. Except in Ireland, migration has driven most of the recent population expansion.
In contrast, almost all countries in Central, South-Eastern, and Eastern Europe saw substantial population declines, due to a combined effect of natural population decrease and emigration. Several countries, such as Bulgaria, Latvia, Lithuania, Moldova, Bosnia and Herzegovina and Kosovo (not shown) observed a shrinking of their populations by 19% or more, unprecedented in times of peace. Several richer countries of the region – Czechia, Slovenia, and Slovakia – have recorded slight population increases and in Russia a large surplus of deaths over births has been almost entirely offset by positive net migration from the countries of the former Soviet Union.
Following turbulent changes and declines in period fertility throughout the 1980s and 1990s, fertility in Europe appeared to split into a north-west vs. south-east divide. Northern and Western Europe (with the exception of Germany, Austria and Switzerland) reached moderately low fertility, with the period Total Fertility Rate (TFR) at 1.7–2.0. All other regions in Europe had either low or very low TFR, typically reaching between 1.2 and 1.4. This regional differentiation was firmly established by the late 1990s, and was retained during the period of gradual recovery in fertility during the 2000s.
However, the fertility divide began to narrow following the onset of the economic recession in Europe, often continuing on even after the recession ended. Period TFR has increased vigorously in Eastern Europe, in part supported by pronatalist policies in Russia, Belarus and Ukraine. Fertility also recovered in Central-Eastern Europe, South- Eastern Europe as well as in Austria, Switzerland and Germany, where it reached the highest level since the 1970s. The TFR of several regions – Eastern Europe, Central-Eastern Europe and Germany, Austria and Switzerland, now occupies a previously vacant ‘medium’ position, at around 1.5–1.7. In contrast, the TFR has declined over the last decade in Western Europe and the Nordic countries, bringing fertility below the peaks reached around 2008–2010. As a result, regional and cross-country fertility differences have reduced across Europe in the last decade. This surprising regional regrouping of period TFR in Europe has taken place at a time when TFR in the United States continued on a downward trajectory, reducing the fertility discrepancy between the United States and European Union.
Despite recurring fears about an impending population implosion in Europe, the population is in fact growing. Countries currently comprising the European Union have collectively experienced sustained population growth ever since the European Economic Community was established in 1957. The territory of the current EU-28 member states saw population increase gradually through a combination of natural population growth and immigration. Between 1960 and 2016 the population grew by 100 million, reaching a 500 million milestone in 2008, and is expected to reach 513 million by 2018. Taking into account the rapid expansion in EU membership, the population of the European Union, as a political entity, has increased at a much faster rate from various waves of EU enlargement.
A s the number of EU member countries grew from six before 1972 to 28 since 2013, the population living in EU territory has tripled since 1960, when it stood at 172 million. Although in 2015 the EU experienced natural population decline (i. e., an excess of deaths over births) for the first time in its history, continued migration is expected to fuel further population growth. According to the baseline projection scenario of Eurostat, the total population of EU-28 is expected to grow to 528 million by 2050, while the high migration scenario propels the EU-28 population even further to 547 million.
However, with the looming secession of the United Kingdom from the European Union, the EU’s earlier rapid population growth through territorial enlargement will reverse. If the United Kingdom leaves as scheduled in March 2019, the EU population is expected to contract by 13 percent, from 515 million to 448 million. Even the high migration scenario of Eurostat envisages an EU population that remains well below the 500 million mark by 2050.
Changes in labour force size present one of the main challenges coming from population aging in the European Union. While labour supply (labour force size) does not develop independently of labour demand, trajectories of future labour supply can be estimated by combining various scenarios of labour force participation with population projections. Such projections are produced regularly by national institutions as well as international organizations. Here we go one step further, factoring in not only changing population structure by age and sex, but simultaneously considering changes in the highest level of educational attainment. This allows us to take into account that 1) labour force participation rates vary not only by age and between men and women, but also by education, and 2) populations are not only changing in their age structure, but also in their educational composition (see data on the front page of this datasheet).
The current (2015) labour force in the European Union comprises of about 245 million workers. In order to estimate a range of future labour supply up to 2060, we defined three scenarios for labour force participation: 1) Constant scenario, where age-, sex- and education-specific labour force participation rates are held constant at the 2014–16 levels; 2) Equalization scenario, which takes into account the effect of strong increases in women’s participation in the labour market, and assumes that female participation rates by age and education reach current country-specific levels recorded for males; and, finally, 3) Swedish scenario, assuming that labour supply in each country would develop towards age-, sex- and education-specific participation rates currently observed in Sweden. This scenario draws from the vanguard position of Sweden, which serves as a model in terms of high levels of female labour force participation and participation above age 50.
The outcomes of these three scenarios are illustrated here for the EU-28 when applying country-specific assumptions. While constant participation rates would lead to a decrease in labour supply by 13 % by 2060, a continued strong increase in female labour market attachment would reduce this decrease to only about 8 %. At the same time, labour force size in the Swedish scenario would maintain near stability.
Our approach to calculating projections allows us to make statements about the future composition of labour supply by education. For example, under the constant participation scenario, the number of persons in the labour force with higher than secondary education is projected to expand by about 45 %. The expected reduction in labour force size would only come from the population with lower and upper secondary education. As a result, the composition of the labour force would change considerably. Further details and country-specific results can be found in the recently published report on Demographic and human capital scenarios for the 21st century (Lutz et al. 2018).
References:
Loichinger, E. and G. Marois. 2018. Chapter 4: Education-specific labour force projections for EU-28 countries. In: Lutz, W. et al. (2018), pp. 44–51 (see next reference).
Lutz W., A. Goujon, S. KC, M. Stonawski, and N. Stilianakis (Eds). 2018. Demographic and human capital scenarios for the 21st century. Luxembourg: Publications Office of the European Union [pure.iiasa.ac.at/id/eprint/15226/].
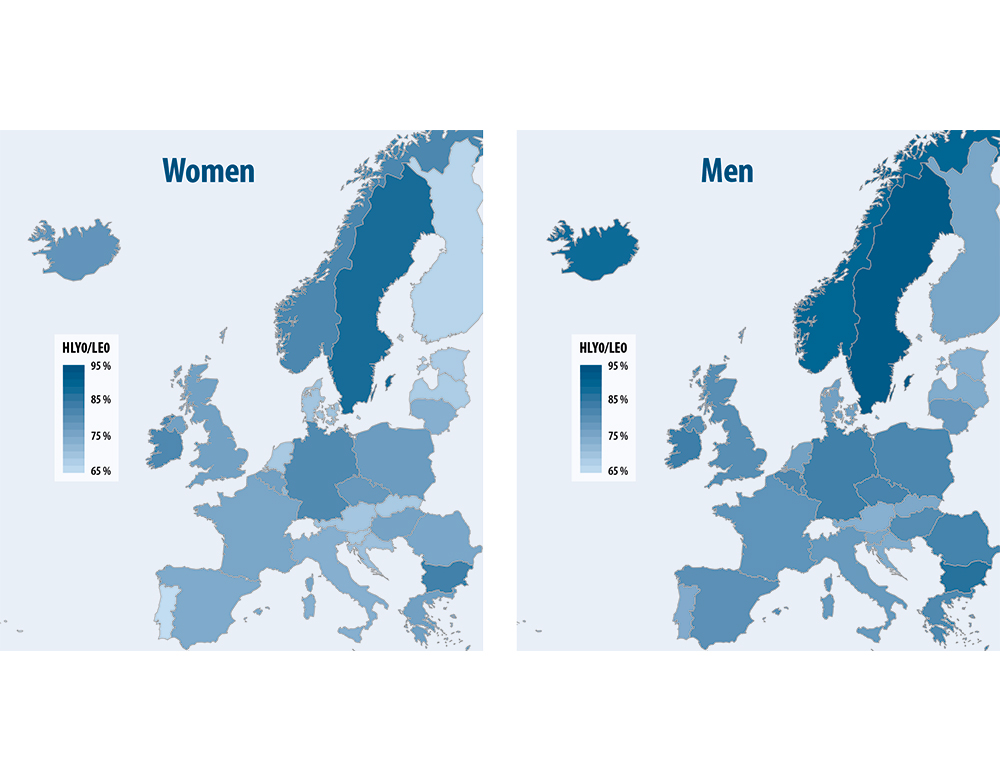
The number of life years spent in good health – Healthy Life Years (HLY) – presents yet another approach to measuring population health. Using data from the 2015 EU-SILC survey, these maps illustrate the proportion of HLY relative to total life expectancy by gender. As the lighter shades of blue indicate, females spend a lower proportion of their lives in good health, while they experience higher overall life expectancy compared to males. This phenomenon has been coined in the literature as the “male-female health-mortality paradox”, with many researchers seeking to understand the underlying mechanisms that lead to such differentials. Some claim that these observed differentials are not paradoxical per se, rather that they are a consequence of the fact that women live longer. Evidence attempting to explain the underlying factors for this gap in HLY, and to what extent the gap results from excess female morbidity or higher female life expectancy, remains inconclusive.
Besides gender disparities in health, the maps also show regional differentials. The gradient of HLY varies throughout Europe, with Sweden showing the best health scenario and Portugal the worst, for both sexes. These observed country differences in HLY have been primarily attributed to differences in education, employment rates, GDP and expenditure on elderly care, as well as differences in the extent of small-scale economic deprivation.
However, there are also some potentially inconsistent cases that deserve a word of caution, particularly when considering neighbouring countries with similar levels of economic development, welfare state systems and overall life expectancy. For instance, the surprisingly low HLY for Finland and Denmark compared to their Scandinavian neighbour Sweden may not accurately reflect real health conditions in these countries and differences between them. The same holds for Austria (low HLY) and Germany (high HLY). Such results may expose issues in measuring and reporting health, which can vary from survey to survey.
What explains these possible inconsistencies? The HLY measure uses the ”Global Activity Limitation Indicator” (GALI), which is based on a question from the EU-SILC survey (European Union Statistics on Income and Living Conditions). The question asks, “For the past 6 months or more, have you been limited in activities people usually do because of a health problem?” with response options, “Yes, strongly limited |Yes, limited |No, not limited”.
Such survey-based health measures require careful interpretation. In contrast to conventional life expectancy, which is derived from population- wide mortality data, survey results are sensitive to cultural-specific perceptions of health limitations and even translation differences. The sensitivity of health measures can result in health information that is incomparable between countries because the self-reported information about people’s health might not reflect their objective health status.
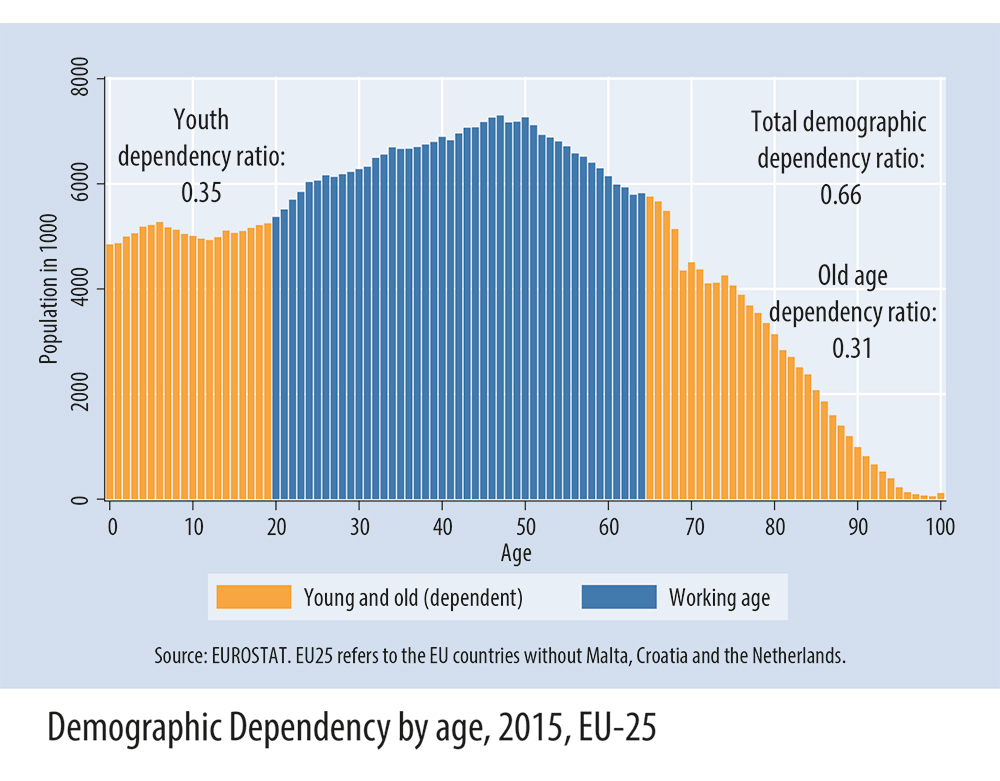
Dependency ratios measure the number of dependent (non-working) persons in a population in relation to the number of workers. Dependency ratios are usually used to illustrate, measure, and project the economic consequences of demographic change.
Demographic Dependency Ratio
The Demographic Dependency Ratio approximates the population of
dependents and workers using age as the defining characteristic. The
Demographic Dependency Ratio is a sum of two components: 1) the
Youth Dependency Ratio, which relates the number of persons below
age 20 (regarded as dependents) to the number of persons aged
20-64 (regarded as workers) and 2) the Old Age Dependency Ratio,
which similarly relates the number of persons aged 65+ (regarded as
dependents) to those aged 20-64. Although the Demographic Dependency
Ratio is a useful summary measure of the population age
structure, it tells little about actual economic dependency.
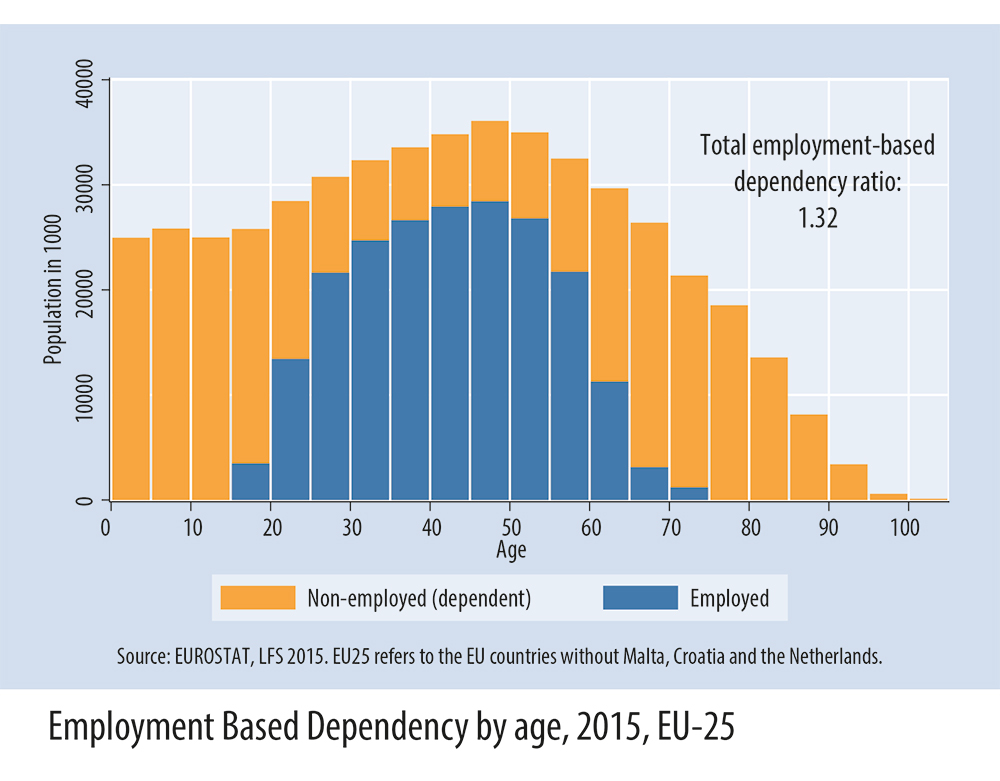
Employment-based Dependency Ratio
The Employment-based Dependency Ratio relates the number of persons
who are not employed to the number of employed persons. Its
value in the 25 analysed countries is at 1.32 dependents per worker,
which is considerably higher than the value for the Demographic
Dependency Ratio at 0.66. The difference between these two values
reflects the large number of persons in working age who are not
employed, either because they are studying, unemployed, retired, or
otherwise do not participate in the labour market. The Employmentbased
Dependency Ratio is lowest in countries with high employment
rates at older ages and low overall unemployment, such as in Sweden,
Switzerland, Norway or Iceland, despite their relatively old populations.
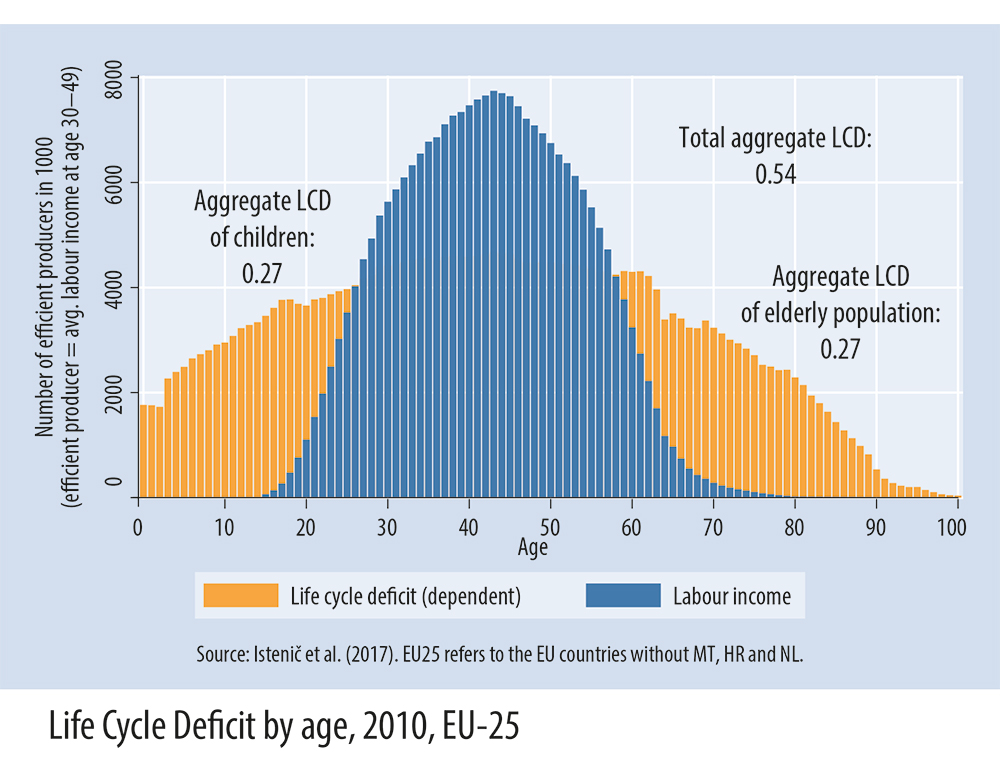
The Life Cycle Deficit: a dependency measure based on labour income and consumption
The aggregate Life Cycle Deficit (LCD) uses the difference between
consumption and labour income as a measure of dependency. The
aggregate LCD consists of two components: 1) the aggregate LCD of
children, defined as the difference between consumption and labour
income of the child population relative to total labour income, and 2)
the aggregate LCD of the elderly, defined as the difference between
consumption and labour income of the elderly population relative to
total labour income. Dependent age-ranges are characterised by average
age-specific consumption exceeding labour income. In the 25
European Union countries analysed, children until the age of 25 and
elderly persons from the age of 59 onwards are dependent. The aggregate
LCD has to be financed by transfers, asset income or dissaving.
In 2010, high values for the aggregate LCD were associated with high
levels of public dissaving. Therefore, the LCD was high in countries with
a large public deficit at the time, such as Greece and Lithuania.
Reference:
Istenič, T., B. Hammer, A. Šeme, A. Lotrič Dolinar, and J. Sambt. 2017. European National Transfer Accounts. Available at: www.wittgensteincentre.org/ntadata
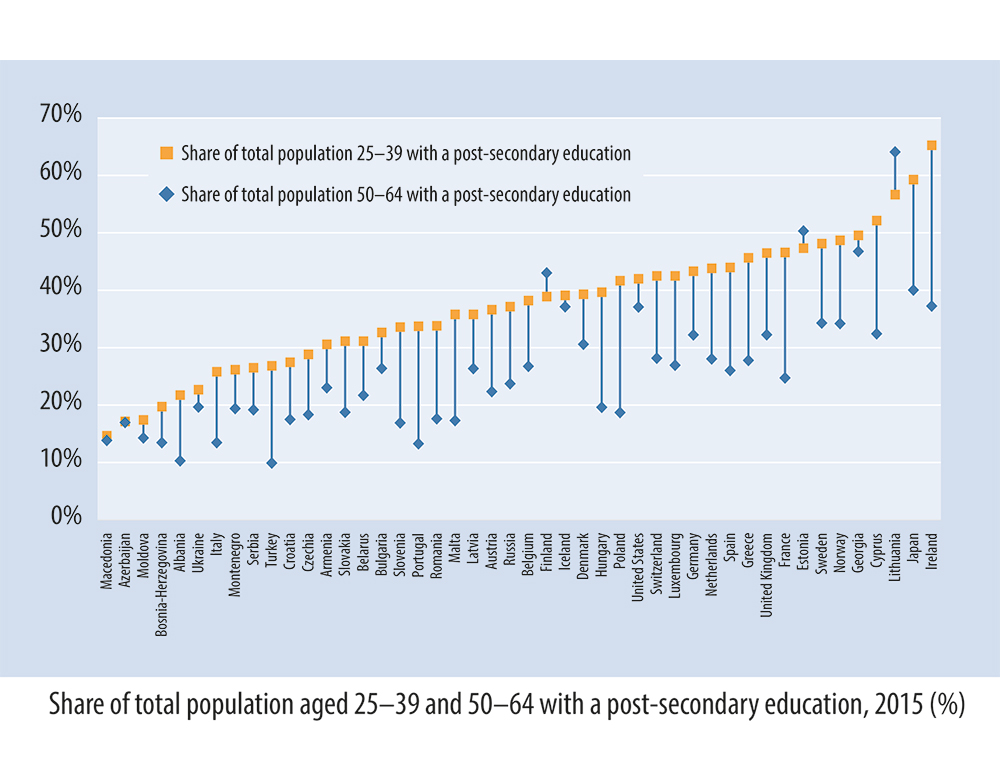
The educational composition in most European countries has been changing rapidly as they have undertaken large efforts to expand higher education. As a result, the share of population with higher education rose rapidly. This shift is clear when comparing the working age population with a post-secondary education in 2015 between age groups 25–39 (born in 1976–1990) and 50–64 (the parent “baby boomer” generation, born in 1951–1965). With the exception of three countries (Finland, Estonia and Lithuania), the younger active generation is more educated than the older generation. Increases in the share with post-secondary education degrees have been substantial (more than 20 percentage points difference) in some countries such as Cyprus, France, Hungary, Ireland, Poland and Portugal. Generational replacement and a continuation of the trend would imply further increases in the overall level of educational attainment in many European countries. The figure also shows that there is a huge diversity between the countries represented: from Macedonia with 14% of its 20–39 population with a post-secondary education to Ireland with 65 %.
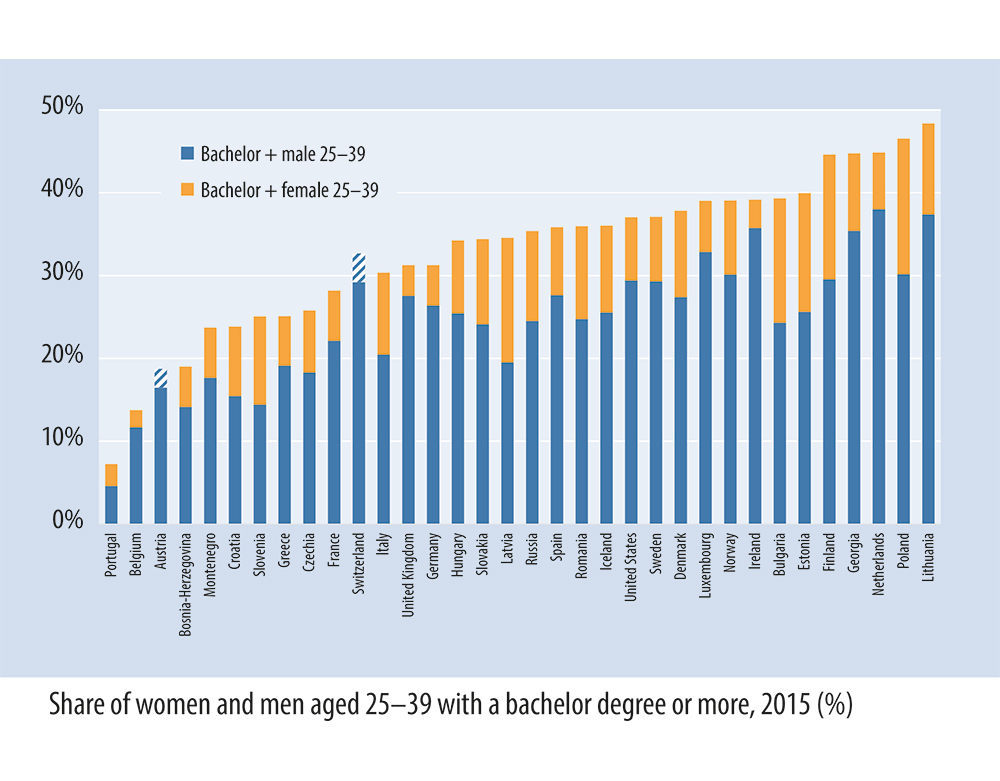
The educational attainment of women in Europe has been growing to the point that more younger women than men have now completed upper secondary and tertiary education. This is illustrated here comparing the share of young women and men (aged 25–39) with a bachelor degree or higher. Independent of the higher education rate of a given country, the share of young women with at least a bachelor degree is always higher than the share of men, with Austria and Switzerland being the only exceptions. At the two extremes of pursuing post-secondary education are Portugal, where only 6 % of people aged 25–39 have a bachelor degree (5 % men, 7 % women), and Lithuania, where 43 % of young people have a bachelor degree (37 % men, 48 % women).
Data source and further information:
Lutz W., A. Goujon, S. KC, M. Stonawski, and N. Stilianakis (Eds). 2018. Demographic and human capital scenarios for the 21st century. Luxembourg: Publications Office of the European Union [pure.iiasa.ac.at/id/eprint/15226/].
The data are available online at: www.wittgensteincentre.org/dataexplorer (Version 2.0 forthcoming)
Europe today remains divided by long-term population trends. This division mostly follows the past geopolitical cleavage between Europe’s East and West.
Countries in the comparatively rich regions – the West, South, and North – continue to experience rising population sizes, due to a combination of minor natural population increases and higher levels of immigration than emigration. Only a few countries, including Germany and Italy, saw a slight natural decrease in their populations between 1990 and 2017, due to deaths outnumbering births. Natural changes in population size have been overtaken by trends in migration, pushing change in the opposite direction. Ireland, Norway, Spain and Switzerland as well as several other smaller countries have seen their populations expand by more than 20 % since 1990. Except in Ireland, migration has driven most of the recent population expansion.
In contrast, almost all countries in Central, South-Eastern, and Eastern Europe saw substantial population declines, due to a combined effect of natural population decrease and emigration. Several countries, such as Bulgaria, Latvia, Lithuania, Moldova, Bosnia and Herzegovina and Kosovo (not shown) observed a shrinking of their populations by 19% or more, unprecedented in times of peace. Several richer countries of the region – Czechia, Slovenia, and Slovakia – have recorded slight population increases and in Russia a large surplus of deaths over births has been almost entirely offset by positive net migration from the countries of the former Soviet Union.
The number of life years spent in good health – Healthy Life Years (HLY) – presents yet another approach to measuring population health. Using data from the 2015 EU-SILC survey, these maps illustrate the proportion of HLY relative to total life expectancy by gender. As the lighter shades of blue indicate, females spend a lower proportion of their lives in good health, while they experience higher overall life expectancy compared to males. This phenomenon has been coined in the literature as the “male-female health-mortality paradox”, with many researchers seeking to understand the underlying mechanisms that lead to such differentials. Some claim that these observed differentials are not paradoxical per se, rather that they are a consequence of the fact that women live longer. Evidence attempting to explain the underlying factors for this gap in HLY, and to what extent the gap results from excess female morbidity or higher female life expectancy, remains inconclusive.
Besides gender disparities in health, the maps also show regional differentials. The gradient of HLY varies throughout Europe, with Sweden showing the best health scenario and Portugal the worst, for both sexes. These observed country differences in HLY have been primarily attributed to differences in education, employment rates, GDP and expenditure on elderly care, as well as differences in the extent of small-scale economic deprivation.
However, there are also some potentially inconsistent cases that deserve a word of caution, particularly when considering neighbouring countries with similar levels of economic development, welfare state systems and overall life expectancy. For instance, the surprisingly low HLY for Finland and Denmark compared to their Scandinavian neighbour Sweden may not accurately reflect real health conditions in these countries and differences between them. The same holds for Austria (low HLY) and Germany (high HLY). Such results may expose issues in measuring and reporting health, which can vary from survey to survey.
What explains these possible inconsistencies? The HLY measure uses the ”Global Activity Limitation Indicator” (GALI), which is based on a question from the EU-SILC survey (European Union Statistics on Income and Living Conditions). The question asks, “For the past 6 months or more, have you been limited in activities people usually do because of a health problem?” with response options, “Yes, strongly limited |Yes, limited |No, not limited”.
Such survey-based health measures require careful interpretation. In contrast to conventional life expectancy, which is derived from population- wide mortality data, survey results are sensitive to cultural-specific perceptions of health limitations and even translation differences. The sensitivity of health measures can result in health information that is incomparable between countries because the self-reported information about people’s health might not reflect their objective health status.
Dependency ratios measure the number of dependent (non-working) persons in a population in relation to the number of workers. Dependency ratios are usually used to illustrate, measure, and project the economic consequences of demographic change.
Demographic Dependency Ratio
The Demographic Dependency Ratio approximates the population of
dependents and workers using age as the defining characteristic. The
Demographic Dependency Ratio is a sum of two components: 1) the
Youth Dependency Ratio, which relates the number of persons below
age 20 (regarded as dependents) to the number of persons aged
20-64 (regarded as workers) and 2) the Old Age Dependency Ratio,
which similarly relates the number of persons aged 65+ (regarded as
dependents) to those aged 20-64. Although the Demographic Dependency
Ratio is a useful summary measure of the population age
structure, it tells little about actual economic dependency.
Employment-based Dependency Ratio
The Employment-based Dependency Ratio relates the number of persons
who are not employed to the number of employed persons. Its
value in the 25 analysed countries is at 1.32 dependents per worker,
which is considerably higher than the value for the Demographic
Dependency Ratio at 0.66. The difference between these two values
reflects the large number of persons in working age who are not
employed, either because they are studying, unemployed, retired, or
otherwise do not participate in the labour market. The Employmentbased
Dependency Ratio is lowest in countries with high employment
rates at older ages and low overall unemployment, such as in Sweden,
Switzerland, Norway or Iceland, despite their relatively old populations.
The Life Cycle Deficit: a dependency measure based on labour income and consumption
The aggregate Life Cycle Deficit (LCD) uses the difference between
consumption and labour income as a measure of dependency. The
aggregate LCD consists of two components: 1) the aggregate LCD of
children, defined as the difference between consumption and labour
income of the child population relative to total labour income, and 2)
the aggregate LCD of the elderly, defined as the difference between
consumption and labour income of the elderly population relative to
total labour income. Dependent age-ranges are characterised by average
age-specific consumption exceeding labour income. In the 25
European Union countries analysed, children until the age of 25 and
elderly persons from the age of 59 onwards are dependent. The aggregate
LCD has to be financed by transfers, asset income or dissaving.
In 2010, high values for the aggregate LCD were associated with high
levels of public dissaving. Therefore, the LCD was high in countries with
a large public deficit at the time, such as Greece and Lithuania.
Reference:
Istenič, T., B. Hammer, A. Šeme, A. Lotrič Dolinar, and J. Sambt. 2017. European National Transfer Accounts. Available at: www.wittgensteincentre.org/ntadata
The educational composition in most European countries has been changing rapidly as they have undertaken large efforts to expand higher education. As a result, the share of population with higher education rose rapidly. This shift is clear when comparing the working age population with a post-secondary education in 2015 between age groups 25–39 (born in 1976–1990) and 50–64 (the parent “baby boomer” generation, born in 1951–1965). With the exception of three countries (Finland, Estonia and Lithuania), the younger active generation is more educated than the older generation. Increases in the share with post-secondary education degrees have been substantial (more than 20 percentage points difference) in some countries such as Cyprus, France, Hungary, Ireland, Poland and Portugal. Generational replacement and a continuation of the trend would imply further increases in the overall level of educational attainment in many European countries. The figure also shows that there is a huge diversity between the countries represented: from Macedonia with 14% of its 20–39 population with a post-secondary education to Ireland with 65 %.
The educational attainment of women in Europe has been growing to the point that more younger women than men have now completed upper secondary and tertiary education. This is illustrated here comparing the share of young women and men (aged 25–39) with a bachelor degree or higher. Independent of the higher education rate of a given country, the share of young women with at least a bachelor degree is always higher than the share of men, with Austria and Switzerland being the only exceptions. At the two extremes of pursuing post-secondary education are Portugal, where only 6 % of people aged 25–39 have a bachelor degree (5 % men, 7 % women), and Lithuania, where 43 % of young people have a bachelor degree (37 % men, 48 % women).
Data source and further information:
Lutz W., A. Goujon, S. KC, M. Stonawski, and N. Stilianakis (Eds). 2018. Demographic and human capital scenarios for the 21st century. Luxembourg: Publications Office of the European Union [pure.iiasa.ac.at/id/eprint/15226/].
The data are available online at: www.wittgensteincentre.org/dataexplorer (Version 2.0 forthcoming)
Europe today remains divided by long-term population trends. This division mostly follows the past geopolitical cleavage between Europe’s East and West.
Countries in the comparatively rich regions – the West, South, and North – continue to experience rising population sizes, due to a combination of minor natural population increases and higher levels of immigration than emigration. Only a few countries, including Germany and Italy, saw a slight natural decrease in their populations between 1990 and 2017, due to deaths outnumbering births. Natural changes in population size have been overtaken by trends in migration, pushing change in the opposite direction. Ireland, Norway, Spain and Switzerland as well as several other smaller countries have seen their populations expand by more than 20 % since 1990. Except in Ireland, migration has driven most of the recent population expansion.
In contrast, almost all countries in Central, South-Eastern, and Eastern Europe saw substantial population declines, due to a combined effect of natural population decrease and emigration. Several countries, such as Bulgaria, Latvia, Lithuania, Moldova, Bosnia and Herzegovina and Kosovo (not shown) observed a shrinking of their populations by 19% or more, unprecedented in times of peace. Several richer countries of the region – Czechia, Slovenia, and Slovakia – have recorded slight population increases and in Russia a large surplus of deaths over births has been almost entirely offset by positive net migration from the countries of the former Soviet Union.